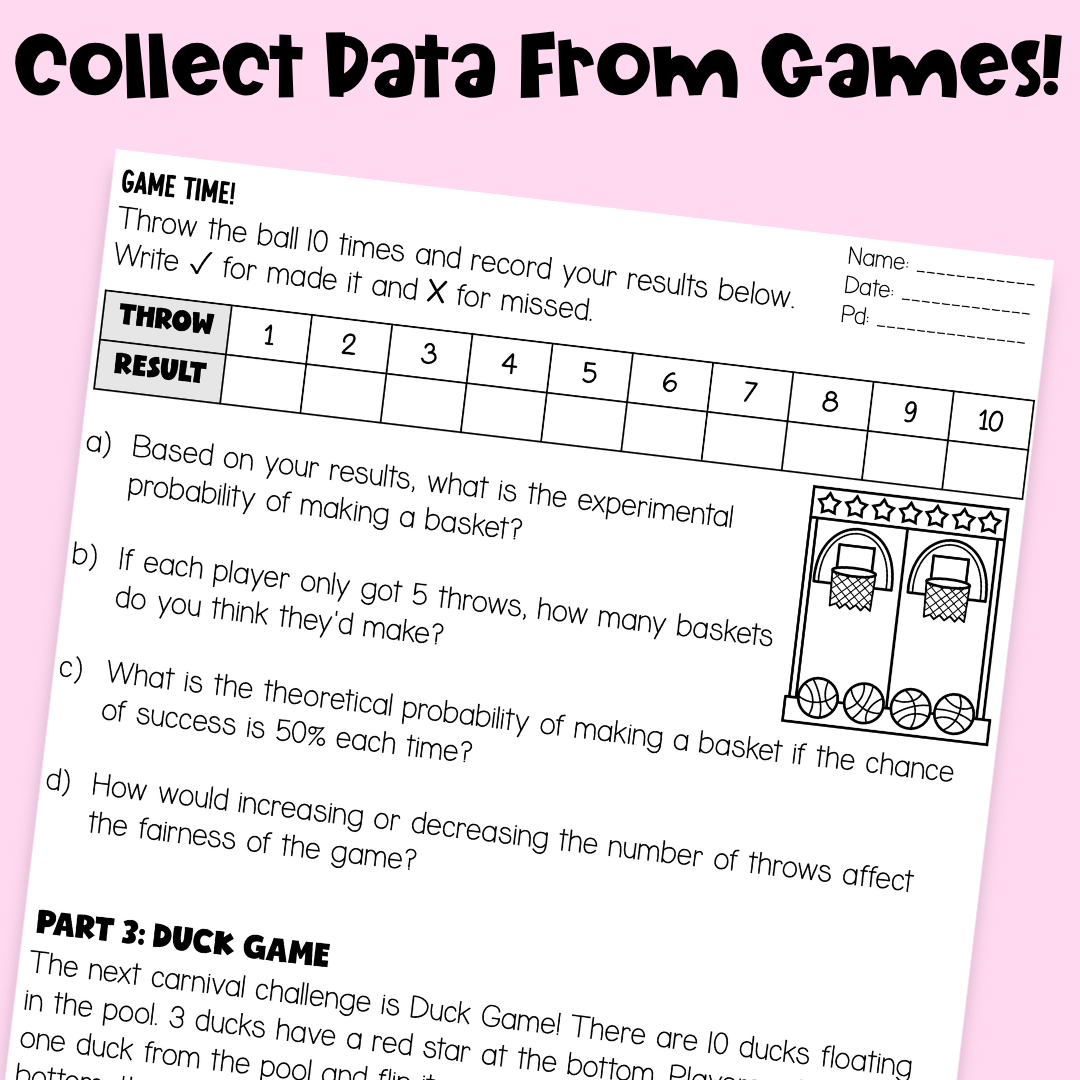
 Image 1 of 4
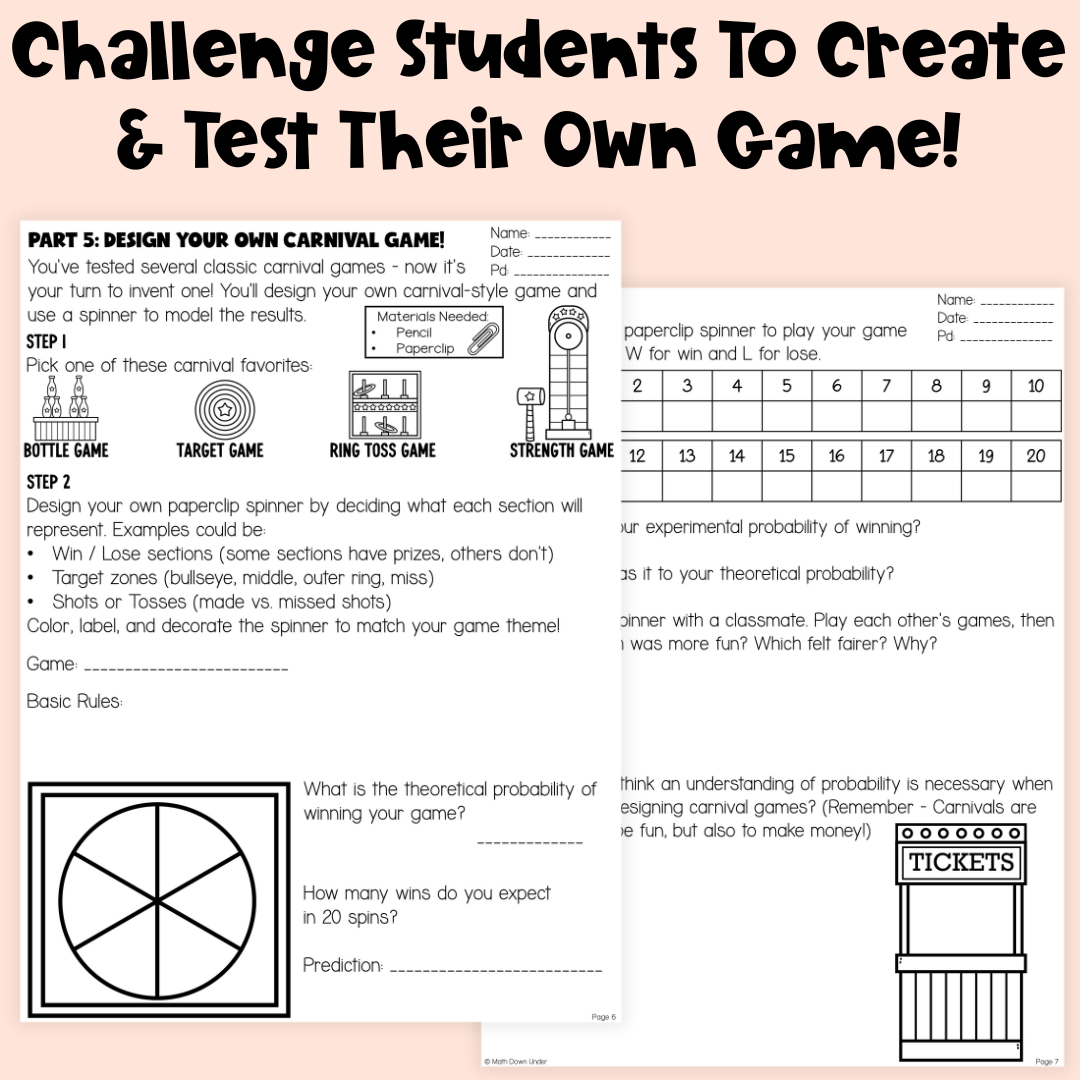
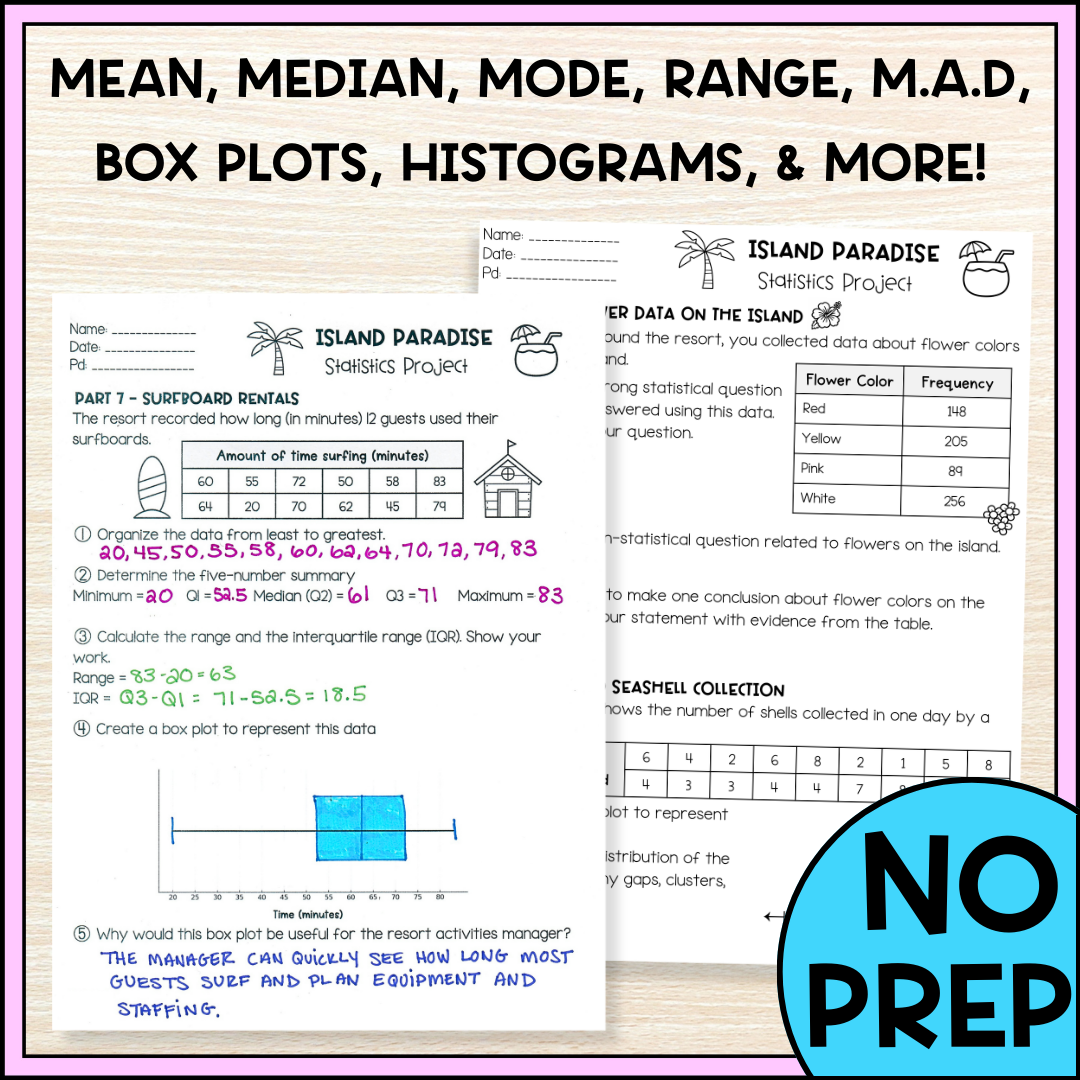 Image 2 of 4
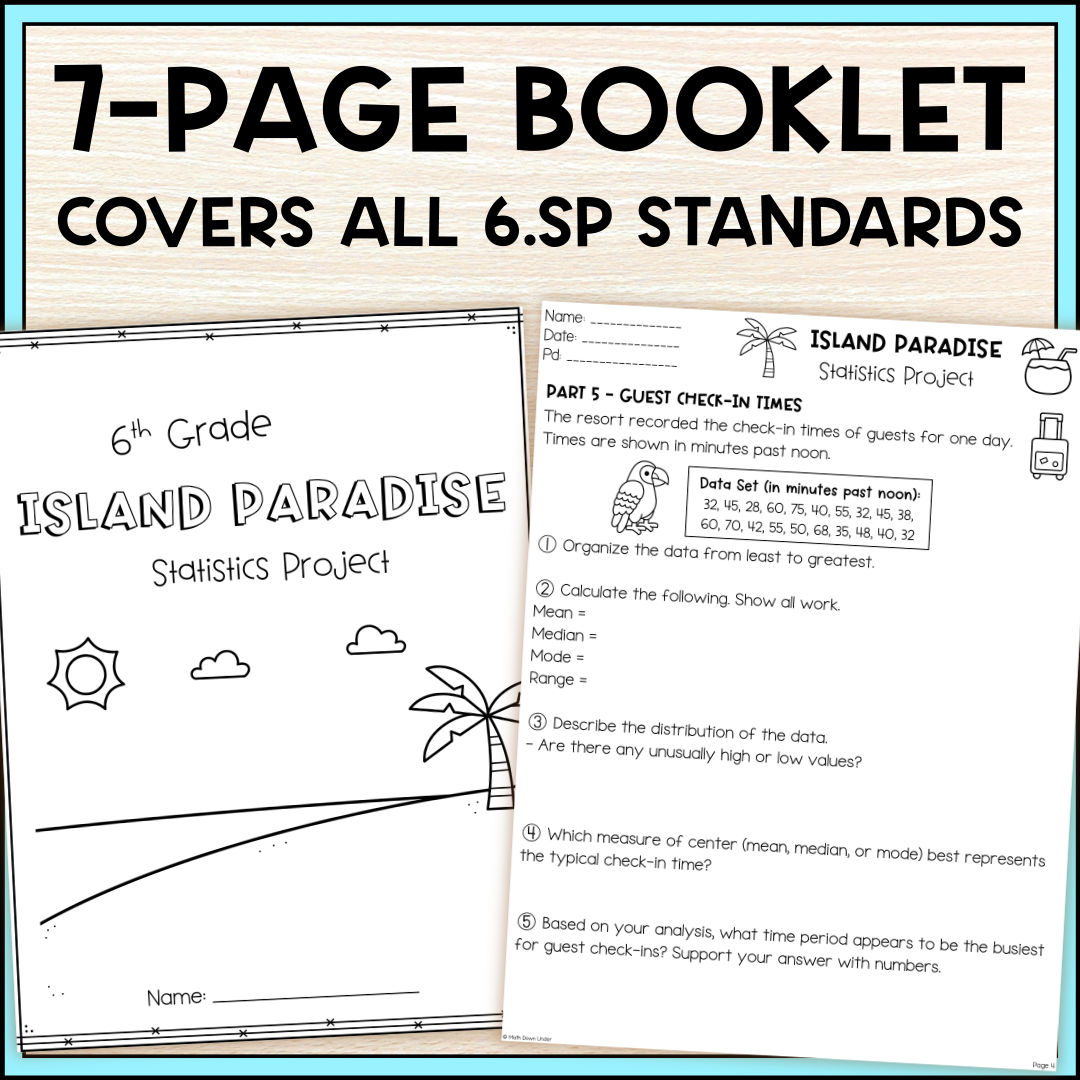 Image 3 of 4
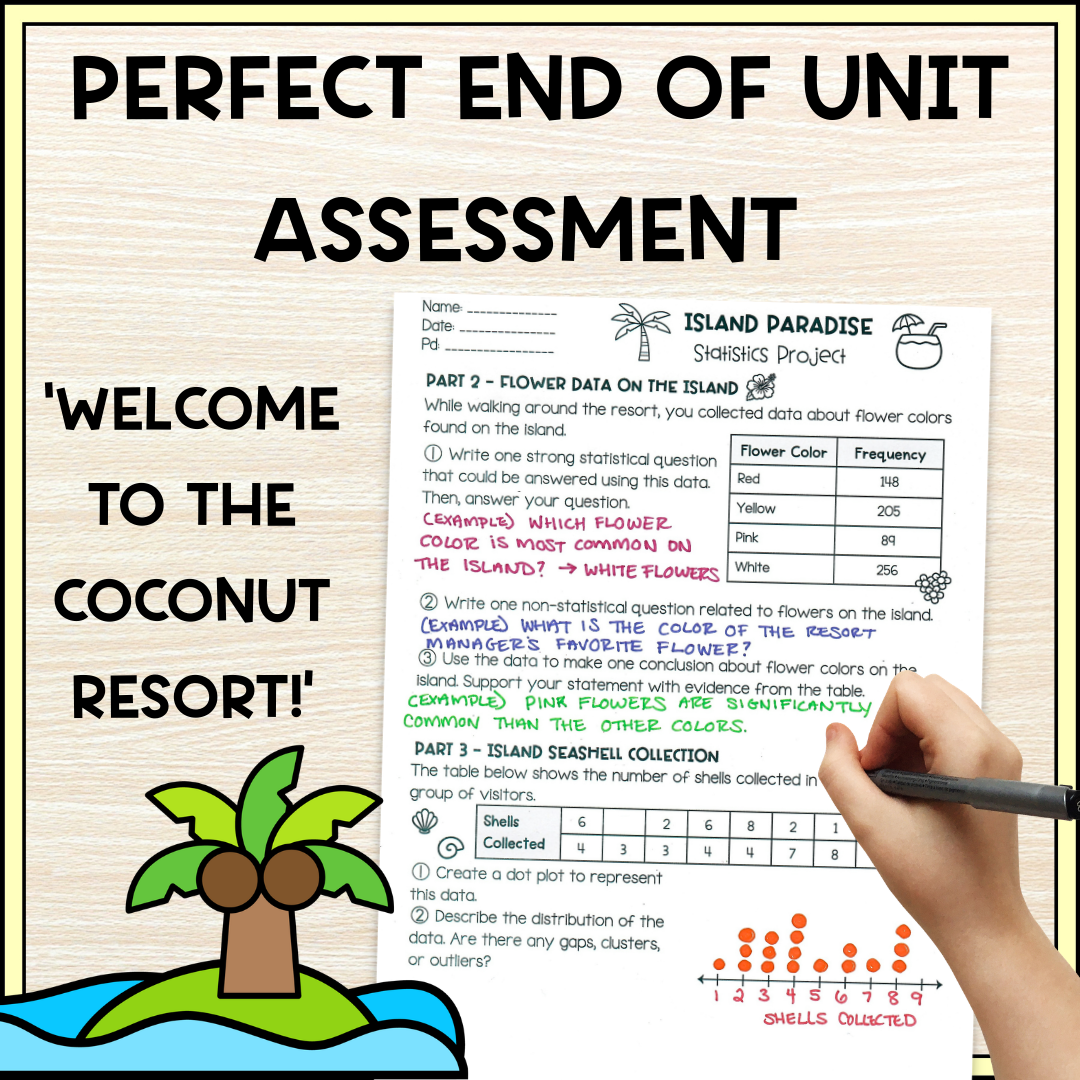 Image 4 of 4
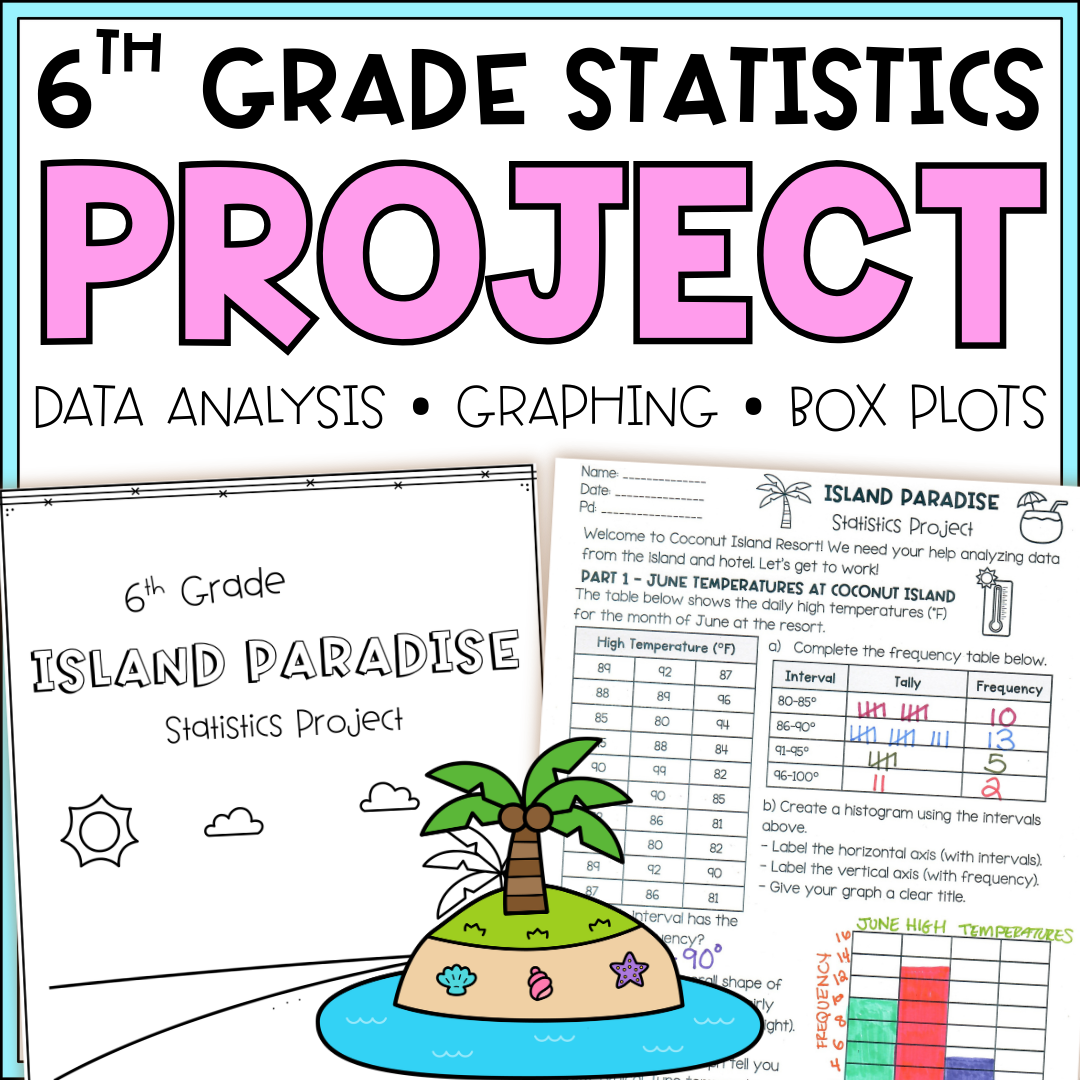
6th Grade Statistics Project | Island Paradise Data Analysis & Math Performance Task.
Take your students on a tropical getaway while mastering data displays and analysis! This 'Island Paradise Statistics Project' is a comprehensive, multi-part math performance task designed to give 6th-grade students hands-on experience with real-world data.
Students will apply their knowledge of measures of center, measures of variability, and data displays to make informed decisions for a fictional island resort.
This resource is perfect as a summative assessment, end-of-unit project, or an engaging review for 6th-grade statistics. Students move through 8 distinct parts, each focusing on a specific statistical skill.
The Details:
7 student work pages, ready to print
No prep - students only need a pencil and ruler
Typically takes 2 to 3 class periods to complete all 8 parts thoroughly
Grading rubric included
Full answer key included
Key Skills & Topics Covered:
Measures of Center: Calculating Mean and Median.
Measures of Variability: Finding Range, Interquartile Range (IQR), and Mean Absolute Deviation (MAD).
Data Displays: Constructing and interpreting Histograms, Dot Plots (Line Plots), and Box Plots (Box-and-Whisker Plots).
Statistical Questions: Identifying and writing statistical vs. non-statistical questions.
Data Interpretation: Describing distributions (clusters, gaps, peaks, outliers) and identifying shapes (symmetrical vs. skewed).
Real-World Application: Using statistics to compare two different datasets (Snorkeling Tours) and justify recommendations.
Why You’ll Love It:
No-Prep & Ready to Print: Just print and go!
Fun theme
Standard Aligned: Directly aligns with CCSS 6.SP.A.1, 6.SP.A.2, 6.SP.A.3, 6.SP.B.4, and 6.SP.B.5.
Perfect for:
6th Grade Math End-of-Unit Assessment
End of Year Project
After State Testing Project
Spring or Summer-themed Math Activity
Save time and engage your students with this "math-cation"!